- WAXP is currently trading at $0.04924 with a rise of -1.73% in 24 hours.
- WAXP’s live market cap is $163,231,126.
- WAXP’s 24-hour volume is $5,834,893 which rose by 46.45% in 24 hours.
A coin connected to the WAX blockchain network is called WAXP. It offers a platform on which users can easily purchase, sell, trade, and accumulate virtual goods.
Delegated Proof-of-Stake (DPoS) consensus is used on the WAXP blockchain to increase scalability and transaction speed. Users can securely exchange collectibles, virtual goods from numerous video games, and other digital assets.
The native utility token of the WAX platform is WAXP. Within the ecosystem, there are numerous use cases for it. These include facilitating trades on the market, motivating users to stake the network for network security, taking part in platform governance, and receiving compensation for validating trades.
Trend Analysis
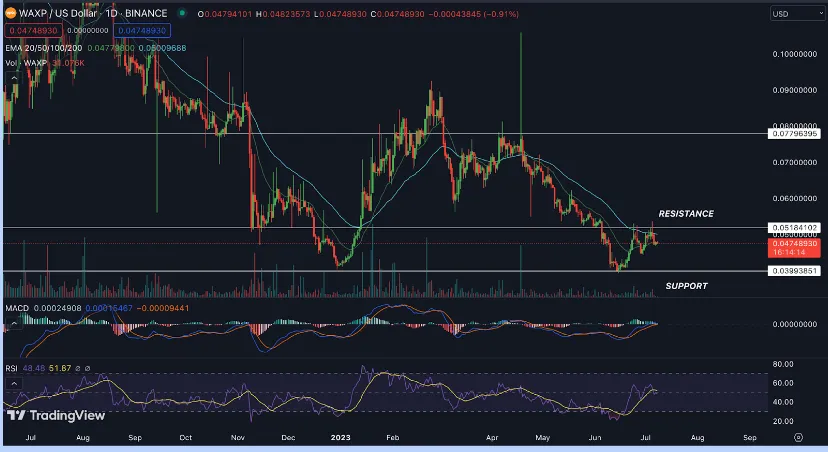
According to technical analysis, the WAXP cryptocurrency is currently showing a negative trend and is predicted to continue moving in that direction over the coming days.
Recently, the price of WAXP has been consistently declining, with lower highs and lower lows. This price decline reflects market weakness in terms of both purchasing interest and selling pressure. The coin is now trading at a low volume, suggesting that there aren’t enough buyers due to unfavorable market sentiments.
WAXP Price Analysis

EMA
Consistently trading below the EMA, the price of WAXP indicates a pessimistic attitude. The EMA’s negative slope suggests that the negative trend may continue.
MACD
The MACD indicator is made up of a histogram, and two lines—the MACD line (fast line) and the signal line (slow line). A prospective downward trend is indicated by a bearish signal when the MACD line crosses below the signal line. We note the following in WAXP’s analysis of the weekly timeframe:
A probable shift towards bearish momentum has been indicated by the MACD line crossing below the signal line. The majority of the histogram is negative, suggesting that the downward trend might continue.
RSI
The RSI indicator measures recent price changes’ magnitude and sheds light on overbought or oversold market circumstances. We note the following in the WAXP weekly timeframe analysis:
A bearish emotion is present when the RSI number is lower than 50.
Volume Analysis
The WAXP 24-hour trading volume is $5,834,893 with an increase of 46.45%.
Technical Levels
- Support – The current support level of the WAXP is $0.3993851.
- Resistance -The current resistance level of the WAXP is $0.5184102.
Conclusion
According to the technical indicators for the daily time frame, WAXP is currently showing a negative signal. According to the MACD, negative crossover is generated and RSI also indicates negative signals. The price of it at this time indicates uncertainty for the immediate future, and the EMA analysis indicates that the short-term trend is negative.
Disclaimer
Only for informational purposes, the author’s views and opinions, as well as those of anyone named in this article, are expressed. They don’t provide advice on money, investments, or anything else. The possibility of financial loss exists while investing in or trading cryptocurrencies.
