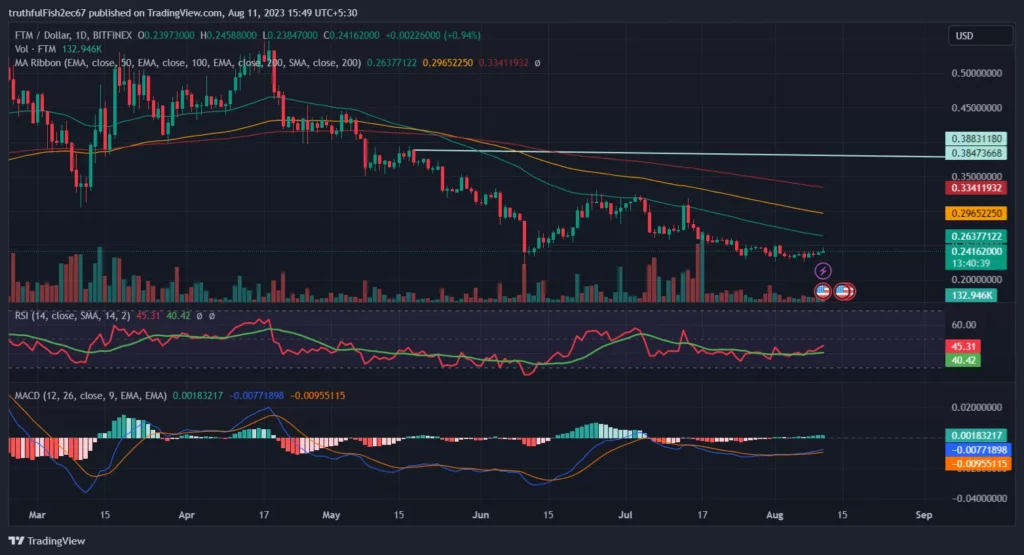
- The FTM price is currency trading below its 50, 100, and 200 EMA levels.
- The Fantom price is expected to be in a consolidation zone from $0.24 and $0.275.
- Currently, the FTM currency is in the equilibrium zone (both buyers and sellers have equal control).
The whole Fantom blockchain ecosystem is powered by FTM, the native utility coin of Fantom. FTM tokens are employed by the network for staking, governance, payments, and fees. The currency is launched by a South Korean exchange, Bithumb and they continue to thrive for innovation and adding new crypto fiat pairs for traders.
FTM: A Further Consolidation in the Cards

FTM is currently trading at $0.242, up by 1.27% on intraday trade. The current 24-hour volume traded for Fantom is 93.27K. Recently, the trading activity has declined in the currency which has resulted in a trend reversal and the coin has mostly stayed bearish.
By looking a the current scenario, the FTM price is trading very close to its support it can be said that after a certain bearish trend, it is expected to show consolidation and might turn bearish again.
Exponential Moving Average (EMA) and Moving Average Convergence and Divergence (MACD)
By looking at the chart, the FTM currency is currently trading below all three levels of EMA in the chart, with 50 EMA being the lowest. It can be seen that in the month of May 2023, there was a big divergence in the 50 EMA level that led to the bearish movement of the currency.
One can see that the buyers have tried to climb it over its 50 EMA, but it is getting rejected multiple times. As per the FTM price analysis, it can be said that it will remain in a consolidation zone for the short term.
The MACD (12 and 26) curve also does not indicate an exciting trend in the price as both the lines are very close to each other, it is expected to have a neutral behavior.
Relative Strength Index (RSI)
The RSI currently stands at 45. It is not either overbought or oversold, hence, indicating the same trend as other indicators. However, it has taken a small rise, but not enough to push the price unless the buyers get an advantage.
Candlestick Patterns
If one closely looks at the recent candles formed in the chart, investors will see that there are a lot of DOJI/Dragonfly DOJI and spinning top candles with short bodies, hence, they do not indicate any bullish/bearish price action for now.
Conclusion
Overall, after looking at all the indicators and patterns in the FTM coin, one can say that the price is likely to move in a consolidation zone till it reaches its 50 EMA level. However, if it breaks out at that level, one might see a climb to 100 EMA, but the long-term outlook of the coin seems to be bearish.
Technical Levels
- Resistance levels: $0.32 and $0.36
- Support levels: $0.195 and $0.175
Disclaimer
The views and opinions stated by the author, or any people named in this article, are for informational purposes only. They do not establish financial, investment, or other advice. Investing in or trading crypto assets comes with a risk of financial loss.
