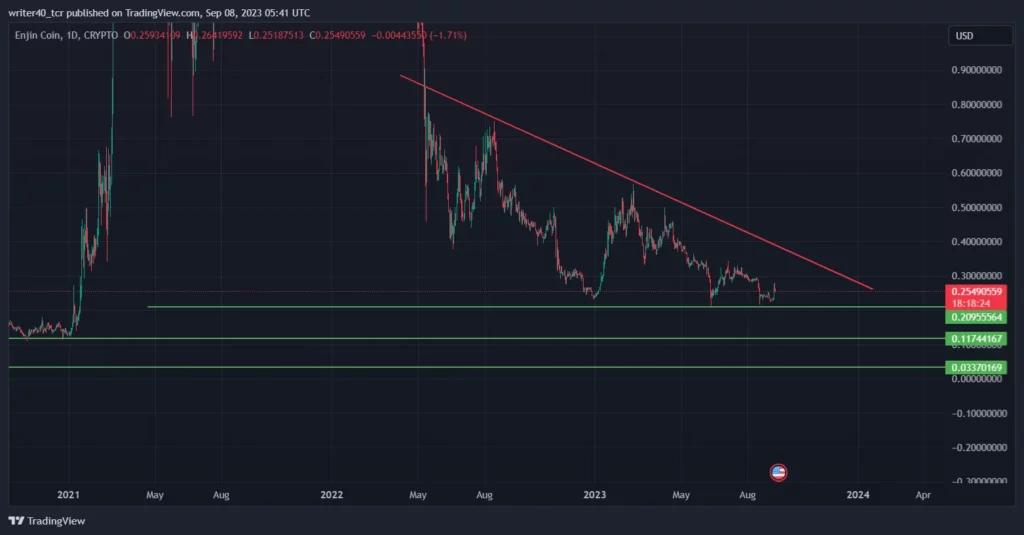
- This token’s price is trading near its 52-week low level.
- Enjin token prices surged more than 9% in a week after interesting buying from the support levels.
- The Enjin coin price eroded almost 95% from its highs.
Market capital of Enjin (ENJ ) – $ 254.75 M
Current market price of Enjin (ENJ ) – $ 0. 254
Enjin coin’s price surged more than 9% in a week and cleared out the strong range of one candle in which the coin has been consolidating for so long. It indicates that the buyers are actively participating at lower levels.
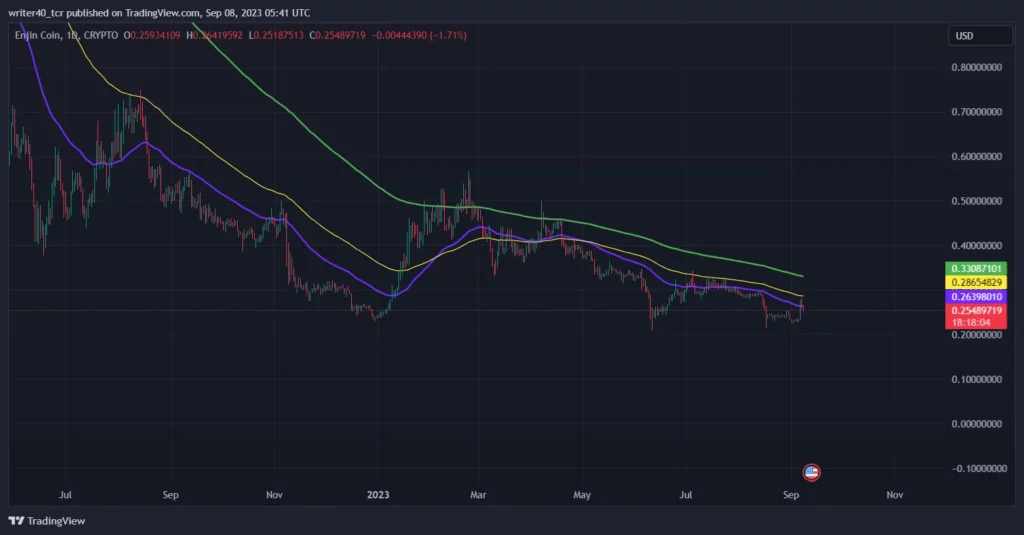
This token is trading below the 50, 100, and 200 EMAs, which indicates that the price is still bearish on a broader time frame and will face hurdles at upper levels. Currently, all three major EMAs stand at $0.263, $0.286, and $0.330 levels respectively.
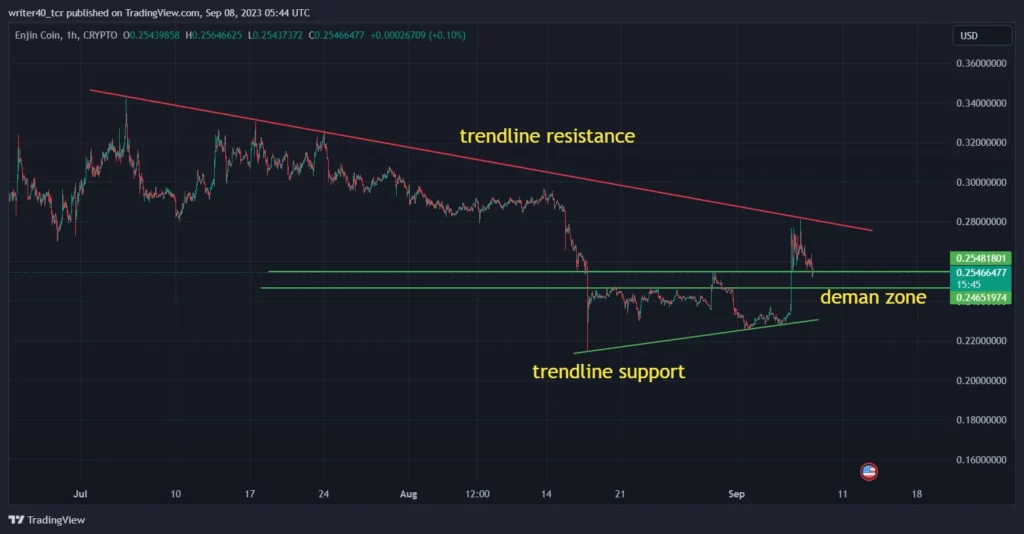
This token’s value increased by more than 14% in a day. It indicated that there is some serious buying happening in this coin. Although it took resistance from the downward-sloping trendline near the level of $0.27, the price has to break that trendline soon to move upward.
Previous resistance that was near $0.251 can act as support from now on along with the upward-sloping trendline, which is placed near the level of $0.221. If we talk about the support zone on the 1-day chart, there are three major support levels which are present near $0.209, $0.117, and $0.033 levels.


Is the Recent Rally a Trap or It’s Just a Consolidation?
If we look into the 1-hour time frame on the chart given below, we can see a sharp upward move from the support levels. It dethroned the resistance zone formed after the price went for a long consolidation phase and took a halt from the trendline resistance present at $0.27.
Now, the above level will act as support along with the trendline which stands near the level of $0.229. At this level, the token price is continuously pushing upward and it seems like forming a base again for the next move.

Conclusion
The ENJIN price saw a huge bounce from the lower levels and the candlestick which it formed is ultra-bullish. The token gained 14% in a single day and held the upper levels till the end. Thus, it can be a positional buying happening at that level which is a good sign.
The price needs to break the trendline on the upper side so that it can go above the 50, 100, and 200 EMA levels. It will attract more buyers to invest some money in the token.
Past Performances
1 WEEK- 9.47 %
1 MONTH- -( 12. 11 ) %
1 YEAR- – ( 50 . 97 ) %
Technical Levels
- Resistance- $0.27
- Support – $0.229 and $0.221
Disclaimer
The views and opinions stated by the author, or any people named in this article, are for informational purposes only and do not establish financial, investment, or other advice. Investing in or trading crypto assets comes with a risk of financial loss.
