- Keurig Dr Pepper Inc. is an American beverage and coffee maker company.
- It was founded in 1981 by Robert Stiller. The stock of the company is listed on the National Association of Securities Dealers Automated Quotations (NASDAQ).
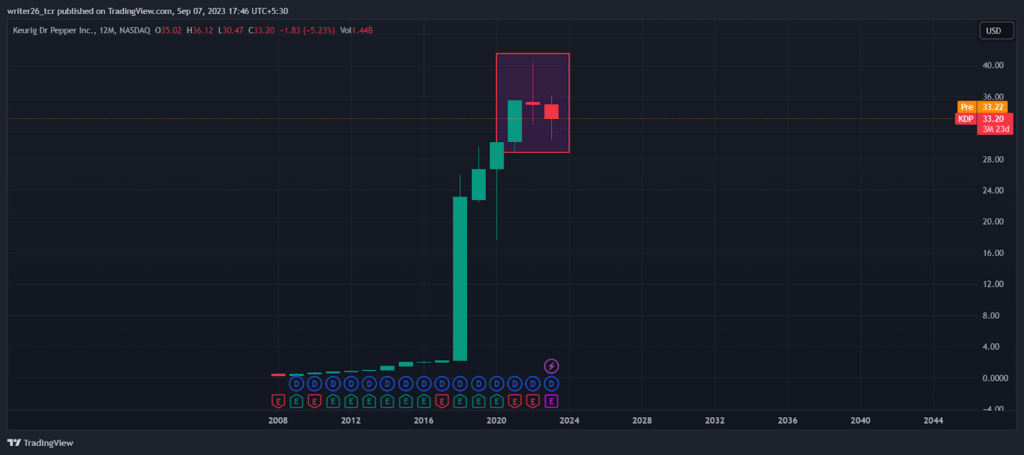
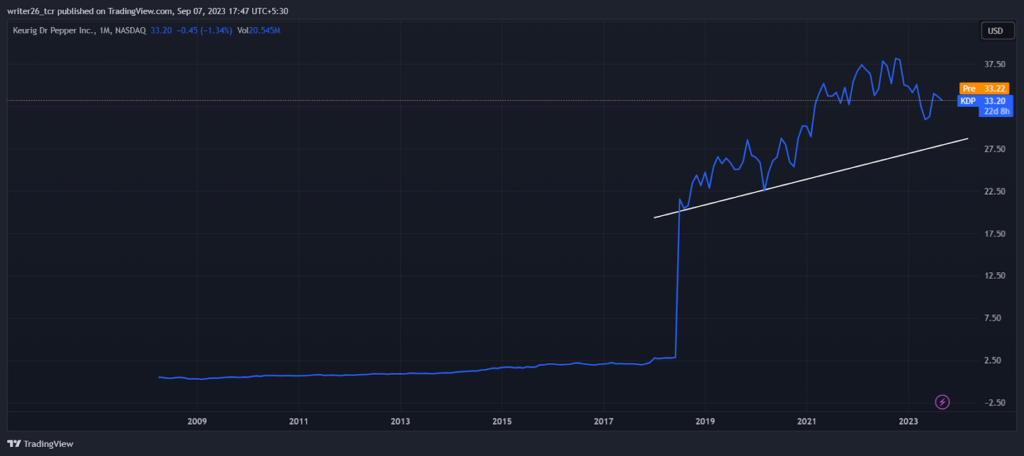
- The stock from 2017 started its up movement and till 2018 it continued forming a straight line.
Keurig Dr Pepper Inc. Stock Offer is performing well overall. It is up by 28.68% overall. It is down by (13.41%) from last year’s performance.
The stock is down by (1.83%) in the last month which is not a good sign of recovery. The stock is in an uptrend in a long time frame. Moreover, we will evaluate the stock through technical analysis to generate some informative information.
Technical Analysis of the KDP Stock (Yearly)

The morning star pattern indicates that the stock will start its retracement. It appears in a bull trend and ends a bull trend after the formation.
Last year, the stock was down which is not good for the stock as it is performing well. Essentially, the stock is in an uptrend. The chances of getting good returns from this stock can be expected to be high.
The stock may fall but due to its past performance, it will go up and will give more profits to its investors.
Technical Analysis of the KDP Stock (Monthly)

The stock was not in a good uptrend, but after 2018 it took off well as a straight line. It started making new higher highs and higher lows in 2019. It may retrace to take support from the trend line. The stock is very good for long-term investment. It is continuously performing well.
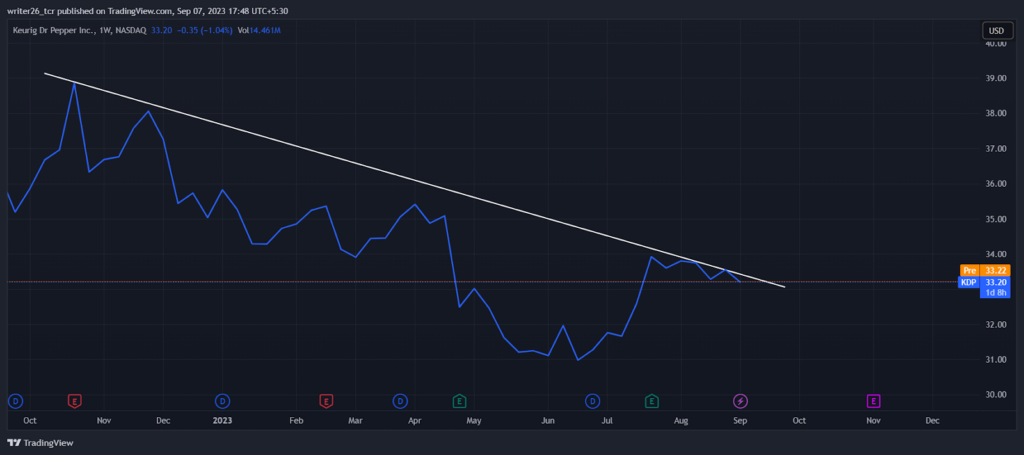
Technical Analysis of the KDP Stock (Weekly)

The stock is continuously in a downtrend in the weekly time frame and made many resistance points on the line. It indicates that the stock may continue its down movement in the future.
It was down by (2.09%) in the last 5 days trading sessions. For short-term investment, the stock is not suitable.
There is an opportunity for short sellers to sell the stock and earn good returns in the upcoming trading days.
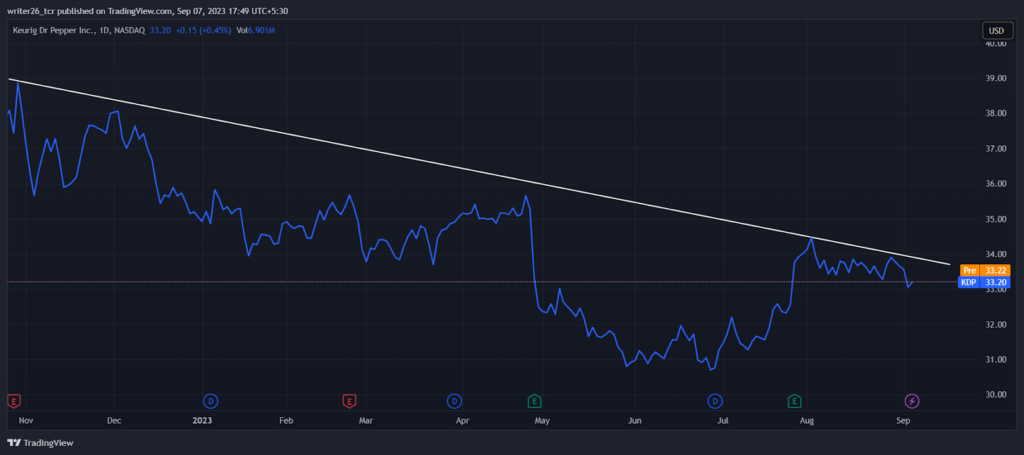
Technical Analysis of the KDP Stock (Daily)

The stock showed negative signs as overall it is moving down in the daily time frame.
It may again come up to make its resistance point and fall after making it. The chances of breakout are less due to its trend.
Conclusion
Through the evaluation of the stock with the help of technical analysis we can say that overall the stock is in an uptrend position.
In the monthly time frame, it was in an upward direction, which can help in earning good returns.
So the stock does have the potential to generate multifold returns on the investment made by the general public in the monthly time frame. In daily and weekly time frames, it is down in the downward direction.
Technical Levels
- Resistance Level- $33.82
- Support Level- $30.77
Disclaimer
The analysis is done for providing information through technical analysis and no investment suggestions are given in the article to be made by investors. The stocks need proper study. So investors should have proper knowledge. Stocks are preferred more than the cryptocurrencies. The stocks are very safe for investment purposes.
