- Berkshire Hathaway’s stock price is showing massive bullish strength.
- Berkshire Hathaway’s stock price is currently trading at $341.0.
- Berkshire Hathaway (BRK.B)’s live market cap is $733.71 billion.
One of the biggest publicly traded firms in the world is the global conglomerate Berkshire Hathaway, which is run by famed investor Warren Buffett. The company’s commercial holdings are varied and include manufacturing, retail, railroad, insurance, and energy.
Known for its long-term investment approach, Berkshire Hathaway has a history of acquiring businesses and holding them for the long term. The company’s portfolio includes a wide range of interests in businesses from a variety of industries, including sizeable positions in household names like Apple, Coca-Cola, and American Express.
Trend Analysis
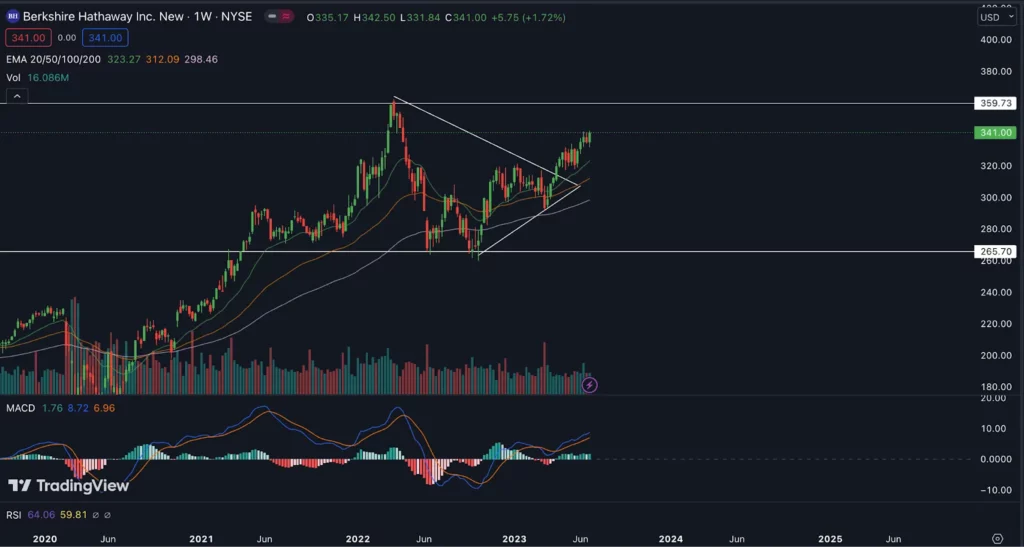
A thorough examination of the stock’s price behavior reveals that Berkshire Hathaway (BRK.B) has been demonstrating a distinct upward trend. With the present price sitting just 5% below that historic milestone, the continuous price movement suggests a good potential for achieving new all-time highs. Notably, the stock recently broke out of a well-defined triangular pattern, indicating optimism for sustained higher momentum and signaling an expected rise toward the next resistance level, which is located at $360.
Looking further into the historical price data, it is important to remember that the BRK.B reached an outstanding high of $363 in March 2020. The price did, however, experience a later phase of adjustment, which resulted in a large decrease of almost 28% to $258. But, notably, the stock found strong support there, signaling a change in the price trend. Since September 2022, Berkshire Hathaway’s stock has resumed its upward velocity, adding to the firm’s overall bullishness. The stock is still showing strong momentum as of right now, raising hopes for a sustained trend till it hits the next significant barrier. We anticipate the possibility of a big upward surge in the case of a successful breach over current resistance.
Berkshire Hathaway (BRK.B) Stock Price Analysis

When examining the price chart, it is apparent that the 20, 50, and 100-day Exponential Moving Averages (EMA) for the shares of Berkshire Hathaway are located below the present price level. This combination is a solid signal of the likelihood of a price hike in the future.
The MACD line and the signal line are both above the zero line, and there is a green histogram on the MACD indicator. This alignment indicates a strong velocity, which could indicate that the market is moving upward.
The volume on the chart is also continuously rising, indicating more market activity. This increase in volume demonstrates that consumers are entering the market at lower prices, supporting the notion that a rise may be imminent.
Conclusion
In conclusion, Berkshire HathAway’s stock price analysis reveals that the stock is currently in a bull run and all the indicators are favoring a positive momentum.
Technical Levels:
- Support – $265.70.
- Resistance -$359.73.
Disclaimer
The views and opinions of the author, or anyone named in this article, are for informational purposes only. They do not offer financial, investment, or other advice. Investing or trading crypto assets involves the risk of financial loss.
