- The price of BAT is trading near $0.1644, The 24-hour trading volume was $11.19 Million.
- The BAT price is observing a rise of +0.06% in the last 24 hours.
- The BAT year-to-date return is -1.21%.
The BAT is a cryptocurrency, it is used to reward users, advertisers, and publishers for their attention and participation in the network. BAT (Basic Attention Token) is the origin of the Brave browser. It is a browser focused on privacy and is an open-source web browser that blocks third-party trackers and ads. It is an ERC-20 token running on the Ethereum blockchain. It has a fixed supply of 1.5 billion coins. BAT is also a platform that aims to create a transparent, fair, and profitable digital advertising ecosystem.
BAT uses blockchain technology, cryptography, machine learning, and game theory to measure and reward users while protecting user privacy and data. BAT also supports digital applications (DApps) and other applications that can benefit from job monitoring.
Trend Analysis
By considering trend and price information history, we can say that BAT is experiencing a downtrend. The price has declined -16.54% within a week and we can say that BAT is showing poor performance.
CVX Trading Downwards
Technical Analysis (1D Timeframe)


CVX Price Analysis
EMA:
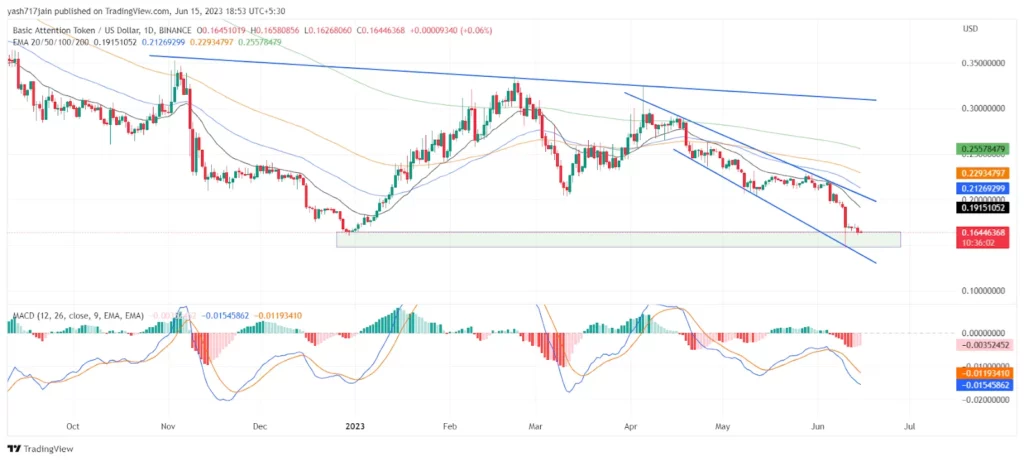
The BAT price is currently below the 20 and 50 EMAs, which indicates that the price will decline in the future. If sellers continue to lower the price, it could drop further in a week. So, selling will be seen more.
200EMA:
The price of BAT at present is trading below 100 and 200 EMA which suggests the price could fall shortly. If the sellers continue to push the price downwards, it could fall more in its value within a week. Hence, indicating sell.
MACD:
In this case, the MACD line is at -0.0154 and the signal line is at -0.0119. Both are on the negative side and are giving bearish signals and also below the zero line.
Also, when the signal line gets cut by the MACD line from below, the indicator is considered bullish. Likewise, when the signal line gets cut by the MACD line from above, the indicator is considered bearish. In this case, The MACD line crosses from above to below the signal line, the indicator is considered bearish. Hence, indicating sell.
RSI:
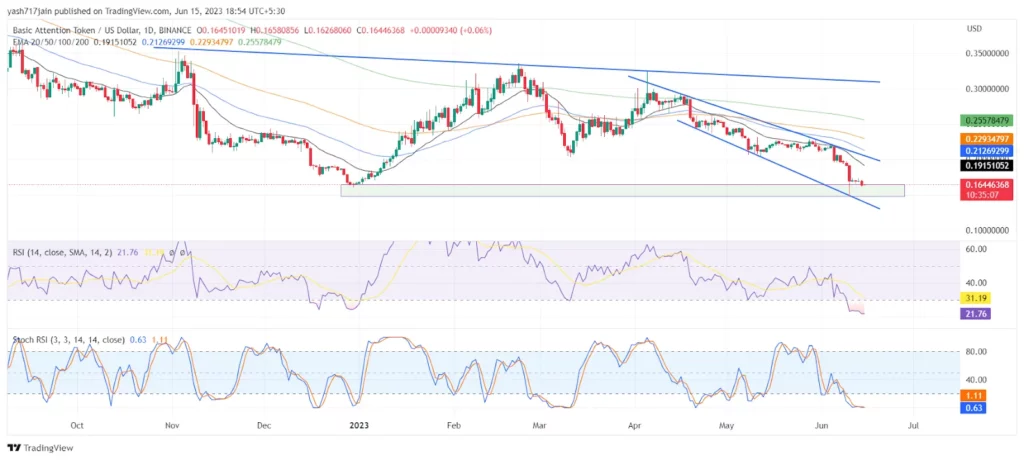
The RSI line has been moving in the oversold territory for the past few days. The 14 SMA has a value of 31.19 points and the RSI line is around 21.76. This indicates that the BAT market is in the oversold zone.
Stoch RSI:
The Stochastic RSI fluctuates between 0 to 100. With readings below 20, it is considered oversold and those above 80 reflect overbought conditions. The current %d line is at 1.11 and the %k line is at 0.63. This indicates that BAT is in an oversold zone.
Trendline Analysis:
As per the Trendline, drawn on the chart it seems it’s respecting the Trendline. It’s declining from the trendline and following the drawn channel in the chart but can go downwards more shortly. So, the price of BAT can continue to fall or consolidate within the trendlines range.
Conclusion
According to the analysis, the indicators are supporting the bears. If the price continues to move under the seller’s control, it is expected to fall shortly. It can also consolidate at the current levels. Presently, the sentiments of the investors and traders are bearish regarding the price of BAT in the 1D timeframe.
Technical Levels:
- The Nearest Support Zone – $0.152 then $0.135
- The Nearest Resistance Zone – is $0.206 then $0.223
Disclaimer
In this article, The views and opinions stated by the author, or any people named are for informational purposes only, and they don’t establish investment, financial, or any other advice. Trading or investing in cryptocurrency assets comes with a risk of financial loss.
