- The Amazon stock: AMZN has been in an uptrend since May 2023, can it continue
- A big difference between gross margin and operating margin, where is company spending.
- MACD indicated a downfall in the short term, is it the time to short-sell?
About Amazon Inc
Amazon is an online e-commerce and web services provider multinational company headquartered in Washington, USA, which is listed on NASDAQ. It is also known as ‘The Everything store’ ‘ which can give an idea of the products it sells online. With over 1.4m EmployeeesAmazon is being led by the founder and CEO Jeff Bezos.
Some financials and Key performance ratios
- Amazon’s revenue for the last quarter that ended on March 2023 was $127.3Bn with an increase of 9.37% from the last year
- The Operating income of Amazon was recorded as $4.77Bn in the last quarter
- The net profit of Amazon was recorded as $3.17bn in the last quarter
- The gross margin of Amazon stands at 44.7%
- The operating margin stands at 2.54% which indicated a huge expense in Marketing, logistics, and Salaries
- The net profit of Amazon stands at 0.82%
- The P.E ratio of Amazon is staggering 306.93
- The Return on equity is 3%
- The Debt to equity ratio is 0.43
The Metrics have been calculated by financial statements, provided by macrotrends.net
Amazon Stock Previous Price Action and Forecasting
Amazon Stock Previous Price Action
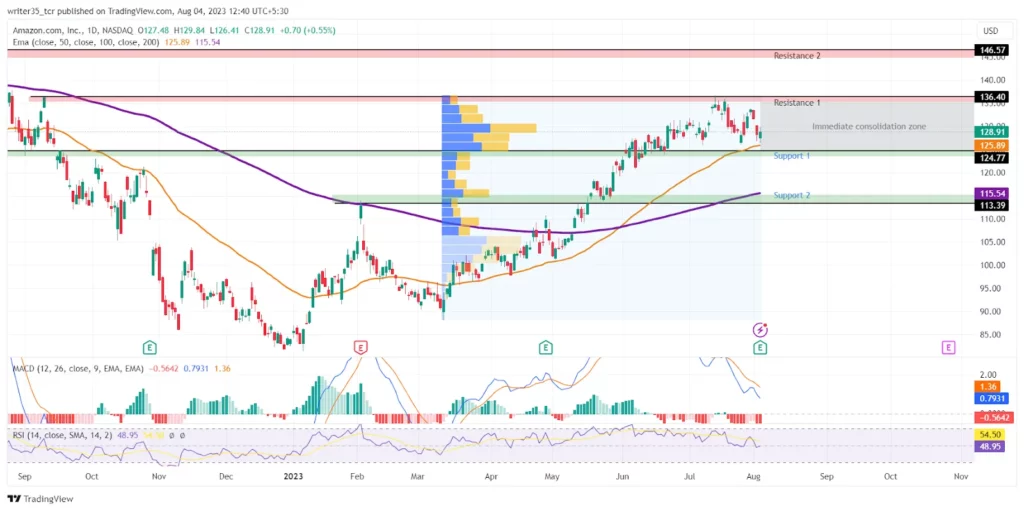
The pricing of Amazon was trading in good volumes in December 2022. From January 23 to May 2023 price was consolidating. until bulls broke the resistance of a level, of $113.4 made in February 2023.

Amazon Stock Previous Price Action
Currently, the price is seen in an uptrend with the crossing of EMAs and the breaking of resistances
Support and resistances: The 1st support is made at the level of $124, although the price is really close to that, it is having a good amount of volume to cushion the bulls. The second support is at the price value of $113. if the price breaks the first one then it can be seen moving towards the second support.
The resistances are at the price level of $136 for Resistance 1, whose confirmation goes back to Sept 2022, The second resistance is on the level of $146.5 which is again confirmed in August of 2022
Indicators
MACD
The signal line has crossed the MACD line and has come down showing a sign of a short-term fall in the price. The difference between the two is also significant as of 1.53.
RSI
The Relative Strength index does not have anything to say at the moment: the strength point is at the level of 48 which is indicating a sideways market.
EMA’s
The 50 EMA crossed the 200 EMA at the end of May this year. Since then the difference between them kept getting bigger. Right now the levels are $125 and $115 for 50 and 100 EMA respectively
The prediction will go with the MACD analysis as being the leading indicator, which is showing a bearish market in the short term. The market knows that as one of the top 5 companies Amazon has no issues reporting huge revenues. which is unlikely to affect its share price unless something happens otherwise
Conclusion
Amazon, founded in 1984 is an online ecommerce and web services provider company that is listed on NASDAQ, it is currently headquartered in Washington. The company reported a revenue of $127Bn in the quarter that ended in March 2023. Currently, an uptrend with MACD indicates a short-term fall.
Technicals
Support: $124.7, $113.39
Resistance: $136.4, $147.5
RSI: 48
50 EMA: $125.8
200 EMA:$115.54
Disclaimer
The views and opinions stated by the author, or any people named in this article, are for informational purposes only. They do not establish financial, investment, or other advice. Investing in or trading crypto assets comes with a risk of financial loss.
