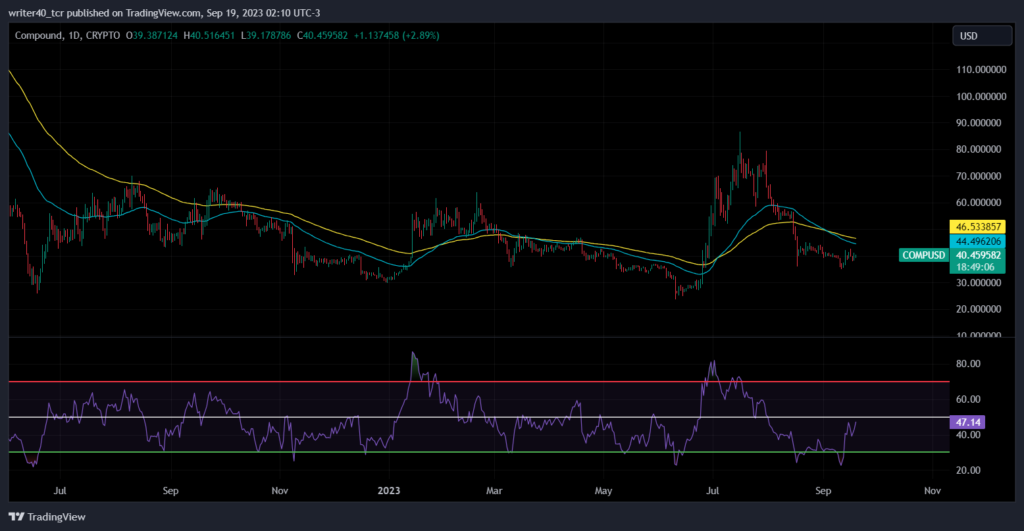
- Compound price has surged over 12.92% in a week but declined by 5.14% in a month and 17.92% in a year.
- Compound price is consolidated in a range for more than a year.
- Compound price is trading below 50 and 100 EMAs.
Market Capital of Compound price- $316.50 Million
Current Market Price of Compound- $40.407
Coin overview
In the current session, the price of the Compound coin is up by $0.979 (2.49%) which indicates that the buyers have an upper hand in today’s session. The price of the coin has surged by 12.92% in a week which indicates that the price is gaining some momentum in a sideways range.
The price of the Compound coin has melted down over 95% from its high of $913.4 which was created in May 2021, which shows that the investors have gone through some serious pain over the period. The price has recovered from its 52-week-low level and is trading about 64% above the 52-week low.
The price is now consolidated in a broader range of $74 and $24 for more than a year. The price is currently trading in a sideways to a downward trend as the price has declined over 5.14% in a month and 17.92% in a year which indicates that the trend is still downward.
Technical Analysis of Compound Price:
The price has declined about 30% in just three days of August month and since then the price has been trading inside the range of the last bearish candle of that fall. Even after 32 trading sessions passed the price has not been able to close either above or below the high or low of that candle.

As per the chart, the price tried to escape from this range in July but it was a trap for the buyers as the price showed a fake breakout and came back to the range again. Since then the price has shown a sharp decline in the price and formed a big bearish candle which shows that the sellers are still very aggressive at upper levels.
If we talk about the resistance level then the price can face resistance near the level of $64 which was its previous resistance level and the price tried to create it as a support but failed to do so. Now the same level will act as resistance to the price and $81 will also act as resistance. The support is present near $24.42

The price is trading below the important EMA levels of 50 and 100 which are present near $44.49 and $46.53, which can restrict the price to go up. The slope of the EMA is also currently slightly downward and the price recently witnessed an EMA crossover. The RSI is rising sharply indicating that the price is gaining momentum.
Conclusion
The relative Strength Index is rising sharply and is currently at 47 which indicates the buyers are gaining momentum which we can confirm by looking at 1 week’s return. The price can face some rejection from the EMA level.
Technical levels
Resistance – $64 and $81
Support – $24
Disclaimer
The analysis is done for providing information through technical analysis and no investment suggestions are given in the article to be made by investors. The coins are unpredictable so investors should have proper knowledge. Cryptocurrencies are highly volatile and risky. Investment should be made with proper technical analysis.
